画像処理でやりたいことの実現にフィルタ処理が必要になったんですが、ネット上には画素値に対するオペレーションとしての分析が主で、周波数特性とかの信号処理的観点からの解説って意外に転がってないんですよね。今回、ローパスフィルタ(平均化フィルタ、ガウシアンフィルタ)を選定するにあたり、そこら辺を自分で計算してみました。
周波数特性
フィルタカーネル
画像のローパスフィルタとしてよく使われるのは平均化フィルタとガウシアンフィルタかと思います。3x3の場合の各フィルタの重みを以下に示しますが、平均化フィルタって中央の重みが1のものと2のものの両方を見かけます。その違いについても検討していきたいと思います。
| 1/9 | 1/9 | 1/9 |
| 1/9 | 1/9 | 1/9 |
| 1/9 | 1/9 | 1/9 |
| 1/10 | 1/10 | 1/10 |
| 1/10 | 2/10 | 1/10 |
| 1/10 | 1/10 | 1/10 |
| 1/16 | 2/16 | 1/16 |
| 2/16 | 4/16 | 2/16 |
| 1/16 | 2/16 | 1/16 |
このガウシアンフィルタの重みはに相当します。一般の
については、
で算出できます。
ところで、平均化フィルタ(averaging filter)は平滑化フィルタ(smoothing filter)という表記も見かけますね。これも違いがあるのかどうか、正確な定義を知りたいです。
周波数特性の導出
ここから各フィルタを2次元FIRフィルタとして考えます。
平均化フィルタ1のインパルス応答は、
です。(見たままモードだと&が使えないので縦が揃わない数式が続きます。)
2次元ディジタルフィルタの周波数特性は、以下の2次元離散空間フーリエ変換(2次元離散フーリエ変換とは別)で求まります。
したがって、平均化フィルタ1の周波数特性は
となり、オイラーの公式と三角関数の加法定理より、以下のように表されます。
係数と分母の違いに着目すると、他のフィルタに関しても
と計算できます。
プロット
ここからPython(とNumPy、matplotlib)を使って、算出した周波数特性をプロットしていきます。
Average1.py
import numpy as np
import matplotlib.pyplot as plt
from mpl_toolkits.mplot3d import Axes3D
from matplotlib import cm

W1, W2 = np.mgrid[-np.pi:np.pi:100j, -np.pi:np.pi:100j]  # 100分割

H = (1 + 2*np.cos(W1) + 2*np.cos(W2) + 4*np.cos(W1)*np.cos(W2))/9
H = np.absolute(H)

# figure 1
fig = plt.figure(1)
ax = Axes3D(fig)
ax.plot_wireframe(W1, W2, H)

# Range
plt.xlim([-np.pi, np.pi])
plt.ylim([-np.pi, np.pi])

plt.xticks([-np.pi, -np.pi/2, 0, np.pi/2, np.pi],
           [r'$-\pi$', r'$-\pi/2$', r'$0$', r'$\pi/2$', r'$\pi$'])
plt.yticks([-np.pi, -np.pi/2, 0, np.pi/2, np.pi],
           [r'$-\pi$', r'$-\pi/2$', r'$0$', r'$\pi/2$', r'$\pi$'])

ax.set_xlabel(r'$\omega_1$', fontsize=24)
ax.set_ylabel(r'$\omega_2$', fontsize=24)
ax.set_zlabel(r'$|H(\omega_1, \omega_2)|$', fontsize=24)

plt.savefig('average1_wf.png', dpi=144)
# /figure 1

# figure 2
plt.figure(2)
# extent: 座標[left, right, bottom, top]
plt.imshow(H, cmap=cm.gray, interpolation='nearest', vmin=0, vmax=1,
           extent=[-np.pi, np.pi, -np.pi, np.pi])
cbar = plt.colorbar()

# plotの大きさを調整
plt.subplots_adjust(bottom=0.15)

plt.xticks([-np.pi, -np.pi/2, 0, np.pi/2, np.pi],
           [r'$-\pi$', r'$-\pi/2$', r'$0$', r'$\pi/2$', r'$\pi$'])
plt.yticks([-np.pi, -np.pi/2, 0, np.pi/2, np.pi],
           [r'$-\pi$', r'$-\pi/2$', r'$0$', r'$\pi/2$', r'$\pi$'])

plt.xlabel(r'$\omega_1$', fontsize=24)
plt.ylabel(r'$\omega_2$', fontsize=24)
cbar.set_label(r'$|H(\omega_1, \omega_2)|$', fontsize=24)

plt.savefig('average1_cm.png', dpi=144)
# /figure 2

plt.show()
平均化フィルタ1についてしかソースは載せませんが、係数変えるだけなので。
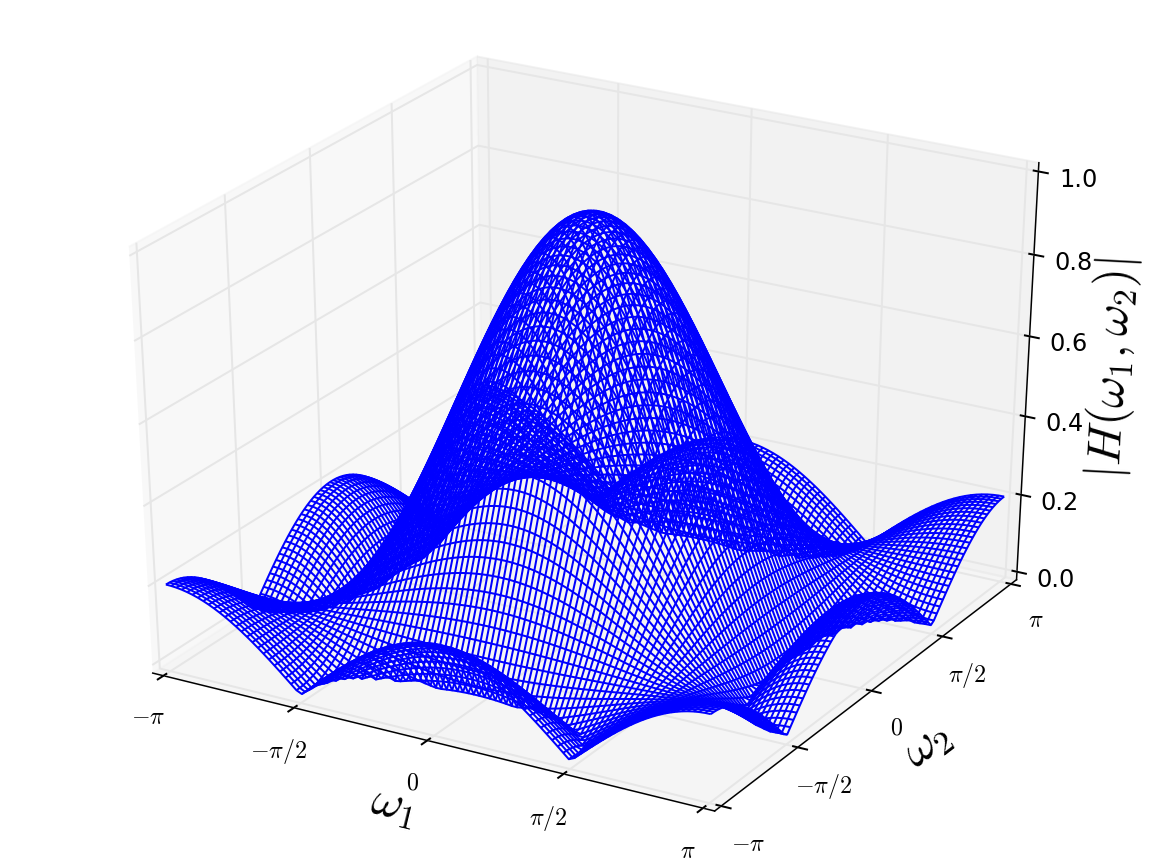
平均化フィルタ1の周波数特性


平均化フィルタ2の周波数特性


ガウシアンフィルタの周波数特性


ローパスフィルタとしては高域の盛り上がりが少ない方がいいです。その見地からすると、平均化フィルタ1は各軸上の±πあたりで隆起が見られます。平均化フィルタ2ではその点で改善が見られますが、斜め方向の周波数に文字通りしわ寄せが行ってしまいます。ガウシアンフィルタは狭義単調減少で、リプルが全く見られません。正規関数はフーリエ変換しても正規関数になるからなんですが、そういういい振る舞いが結果に現れています。
ローパスフィルタとして、ある周波数までは1でそこから0みたいな理想の特性はありませんが、ガウシアンフィルタ優秀ですね。
フィルタリング
フィルタリング、つまり畳み込みをPythonで書きました。
filtering.py
import sys
import numpy as np
from PIL import Image
from scipy import ndimage

if len(sys.argv) != 2:
    print('Usage: python filtering.py input')
    sys.exit(1)

img = np.array(Image.open(sys.argv[1]))

# Color split
img_r = img[:, :, 0]
img_g = img[:, :, 1]
img_b = img[:, :, 2]

# Low-Pass Filters
# Averaging 1
lpf_a1 = np.array([[1, 1, 1],
                   [1, 1, 1],
                   [1, 1, 1]])/9
# Averaging 2
lpf_a2 = np.array([[1, 1, 1],
                   [1, 2, 1],
                   [1, 1, 1]])/10
# Gaussian
lpf_ga = np.array([[1, 2, 1],
                   [2, 4, 2],
                   [1, 2, 1]])/16

# Convolve
# Averaging 1
img_a1_r = ndimage.convolve(img_r, lpf_a1)
img_a1_g = ndimage.convolve(img_g, lpf_a1)
img_a1_b = ndimage.convolve(img_b, lpf_a1)
# Averaging 2
img_a2_r = ndimage.convolve(img_r, lpf_a2)
img_a2_g = ndimage.convolve(img_g, lpf_a2)
img_a2_b = ndimage.convolve(img_b, lpf_a2)
# Gaussian
img_ga_r = ndimage.convolve(img_r, lpf_ga)
img_ga_g = ndimage.convolve(img_g, lpf_ga)
img_ga_b = ndimage.convolve(img_b, lpf_ga)

# Color merge
# Averaging 1
img_a1 = np.empty(img.shape, dtype='uint8')
img_a1[:, :, 0] = img_a1_r[:, :]
img_a1[:, :, 1] = img_a1_g[:, :]
img_a1[:, :, 2] = img_a1_b[:, :]
# Averaging 2
img_a2 = np.empty(img.shape, dtype='uint8')
img_a2[:, :, 0] = img_a2_r[:, :]
img_a2[:, :, 1] = img_a2_g[:, :]
img_a2[:, :, 2] = img_a2_b[:, :]
# Gaussian
img_ga = np.empty(img.shape, dtype='uint8')
img_ga[:, :, 0] = img_ga_r[:, :]
img_ga[:, :, 1] = img_ga_g[:, :]
img_ga[:, :, 2] = img_ga_b[:, :]

Image.fromarray(img_a1).save('a1.png')
Image.fromarray(img_a2).save('a2.png')
Image.fromarray(img_ga).save('ga.png')
PillowのImage形式をNumPyのndarray形式に変換して、各色成分毎にSciPyのconvolve関数を使いました。Pillowにもそういう関数がありますが、SciPyの方が一般のフィルタのサイズ、次元に対応しているのでそちらを選びました。あと、ちゃんと各軸についてひっくり返して(2次元の場合180度回転させて)計算を行っていることにも好感。大抵のフィルタは原点に対して対称なので結果は変わらないですが、こちらのように違いますからね、畳み込みと相関。
結果
原画像

平均化フィルタ1

平均化フィルタ2

ガウシアンフィルタ

ガウシアン→平均化2→平均化1の順にぼやけが少なくなっています。なんでだろ? 予想と違う。
書いてみて、やっぱりPythonすごい。カウンタとか使わずにガバッと配列を操作できちゃう。でも、オブジェクト指向やっぱりよくわかりません。np.array()でなんでImageを変換できちゃうのか。そういう点が隠蔽されているのは利点でもあるんですが、C言語書いてた身からすると腑に落ちない…
参考